
Jupyter Notebook
Mixing rich media in documentation
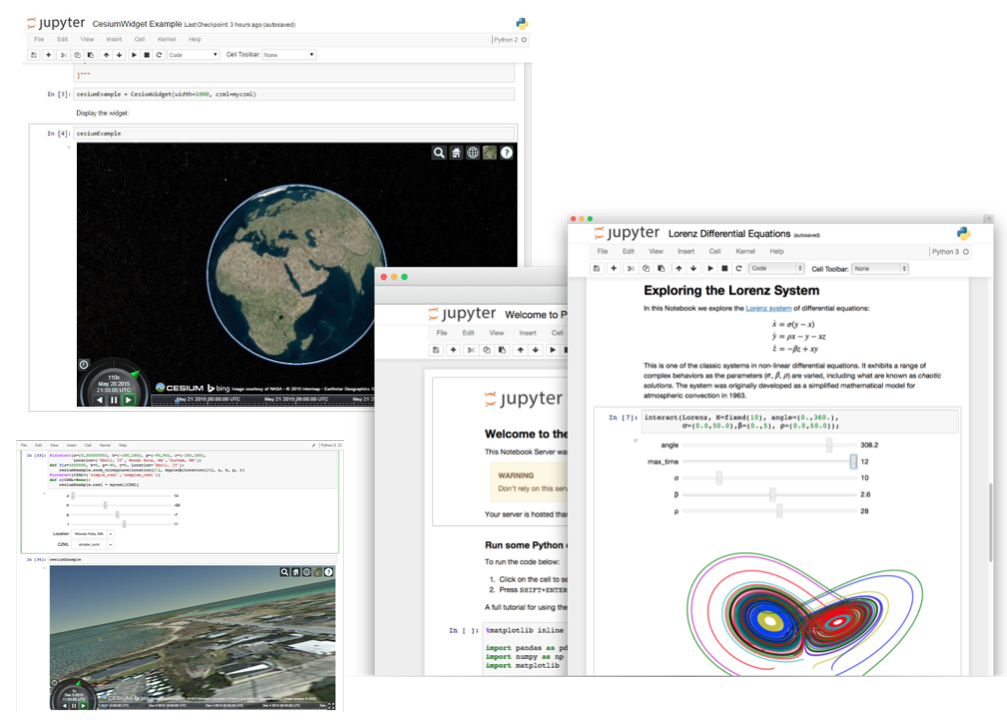
The Jupyter Notebook is a web application that allows you to create and share documents that contain live code, equations, visualizations and explanatory text.
It combines two components:
A web application providing browser-based, interactive authoring of notebook documents.
Notebook documents which store a representation of all content visible in the web application, including inputs and outputs of computations, explanatory text, mathematics, code, images, videos, graphs, maps, and other rich media representations of objects.
Notebooks can be shared with others on GitHub, Dropbox, and the Jupyter Notebook Viewer.
Uses include: data cleaning and transformation, numerical simulation, statistical modeling, machine learning and much more.
Core Features
Create Jupyter Notebooks which can contain:
Marked up text (with headings, styles, paragraphs, etc)
Formulas, mathematics, plots, maps, …
Imported external libraries to add functionality
Code from multiple programming languages, including Python, R, Julia, Bash and many more.
Jupyter Notebooks on OSGeoLive can use geospatial functions from:
Numpy, SciPy Matplotlib, IRIS, Cartopy, gdal, Geopandas, pyshp, Fiona, netCDF4, PostgreSQL, psycopg2, R, rpy2, and more.
Details
Website: https://jupyter.org/
Licence: The 3-Clause BSD License
Software Version: 5.3.2
Supported Platforms: Linux, Mac, Windows
API Interfaces: Python
Support: https://jupyter.org/community.html